INTRODUCTION
The Argentine Pampa is the largest
sedimentary loess plain in South America and includes the province of Buenos
Aires, the largest in the country at 307571 km². This region, part of the Rio
de la Plata grasslands, is characterized by shallow soils, salinity, and
frequent floods and droughts, which limit agriculture and preserve extensive
natural grasslands. Despite these challenges, it remains one of the most
economically productive areas (Golin et al., 2024; Mujica et al., 2021; Jobbágy
& Jackson, 2007).
Intensified
land use has significantly impacted soil properties (pH, salinity) and water
balance, leading to more frequent floods, droughts, and erosion. These changes
disrupt the hydrological cycle by reducing the soil's ability to retain
moisture, which is vital for plant growth, ecosystem stability, and flood
prevention (Mujica et al., 2019; Damiano & Taboada, 2000).
Understanding soil water flow and plant uptake is crucial for addressing these (Sun et al., 2024).
The complex nature of environmental
systems in the Pampas requires the use of process-based numerical models to
predict the effects of land use changes. These models depend on accurate data
on soil hydraulic properties. However, obtaining these parameters by direct
measurement is often costly and challenging. As a result, pedotransfer
functions (PTFs) are often used to estimate these properties using more readily
available information. PTFs have been shown to be effective in improving the
accuracy of hydrological models and improving the prediction of groundwater and
surface runoff processes (Zimmermann
& Basile, 2011).
The accuracy
of numerical models relies on the quality of the soil property databases. Key
parameters, such as field capacity, bulk density, and residual and saturated
water content, are essential for accurately modeling water and solute fluxes.
Global databases, such as UNSODA 2.0, and regional databases, such as those of
INTA in Argentina, are valuable for predicting phenomena such as runoff and
infiltration, as well as for the sustainable management of water resources (Zimmermann & Basile, 2007, 2008).
OBJECTIVES
The
objective of this study was to develop a robust database of soil properties for
the province of Buenos Aires, Argentina, located in the Pampas region, with the
aim of obtaining the most accurate estimation of hydraulic properties for soil
profiles across each cartographic unit in 1:50000 scale soil maps of the
province (Figure 1). This was achieved by digitizing and organizing the soil
series data provided by INTA into structured tables representing the
proportions of cartographic units in the soil maps. The focus was on estimating
hydraulic properties, such as water retention and soil permeability, from
granulometric and physicochemical data, which are essential for modeling
soil-water interactions.
The estimated hydraulic properties were validated against seven
calibrated points, enabling the selection of the most reliable pedotransfer
functions for this region.
METODOLOGY
Study
area
Buenos
Aires Province's heterogeneity is determined by geomorphological, edaphic,
climatic, and phytogeographical differences, which allowed the delimitation of
sub-regions (Oyarzabal et al., 2018). Land is extremely flat, with slopes
ranging from < 0.1 to 5%, and they are naturally covered by temperate
grasslands (Soriano, 1992). The average annual rainfall ranges from ~ 600 to ~
1000 mm, and the average annual temperature ranges from ~ 14°C to ~ 17°C.
(Podestá et al., 1999). This region is distinguished by a moisture gradient
that extends from east to west, along with increasing continental
characteristics as one moves towards the northwest (Burgos & Vidal, 1951).
The
dominant soils in the region are mollisols from the Late Pleistocene-Holocene
sediments (Zárate, 2003; Teruggi, 1957). The low-gradient relief leads to
minimal runoff, with water primarily eliminated through evapotranspiration
(Lavado & Taboada, 2009; Varni & Usunoff, 1999), resulting in recurrent
flooding, increasing salinity, and decreasing the water table depth (Jobbágy et
al., 2017; Barranquero et al., 2012). In the Pampa Ondulada region, the
landscape features gentle ondulations drained by the Paraná and the Río de la
Plata tributaries. Soils consist of clayey loess with low sand content (<
5%) and high silt content (~ 70%), with grain size decreasing from SW to NE
(Zárate & Tripaldi, 2012; Zárate, 2003).
The Flat
Interior Pampa has a gentle relief of eolian dunes that control its poorly
integrated surface drainage and coarse-grained textured soils. The Western
Interior Pampa is a low-relief plain drained by ephemeral streams and the
Quinto River and presents a complex pattern of dunes formed by fine sand and
silt sediments (Zárate & Tripaldi, 2012).
The Pampa
Deprimida consists of a very flat terrain that developed from the same loessic
sediments, contains more sands towards the southwest, and also has inputs of
silty sediments. The deposition of these sediments traced longitudinal
formations several kilometers long, 1-1.5 m high and a few hundred meters wide,
as well as parabolic dunes adjacent to deflation basins. In Pampa Austral (also
known as Pampa Interserrana), loessic deposits form a continuous blanket over
the large and complex sandy dune systems of central Argentina. The sediments
that form this sub-region are coarser and are commonly classified as sandy,
silty clayey loams, although sites with finer textured soils and petrocalcic
horizons can be found that are heterogeneous with varying degrees of
cementation and thickness (Zárate & Tripaldi, 2012; Zárate, 2003).
Soil
charts
In this
study, we utilized vector-based soil data provided by the Instituto Nacional de
Tecnología Agropecuaria (National Institute of Agricultural Technology, INTA) for
Buenos Aires Province on a 1:50000 scale (INTA, 2022). This dataset was derived
from the digitization of the original Soil Charts of the Argentine Republic,
which were developed as part of the Plan Mapa de Suelos de la Región Pampeana
initiated in 1964. This project marked a significant advancement in national
soil classification efforts, focusing on semi-detailed and reconnaissance-level
mapping (1:50000–1:100000). The data offers comprehensive information on soil
series and is publicly available.
To process these data, Python scripts were developed to extract and
parse field data from PDF files containing information on 381 soil series (out
of a total of 383, two of which were unreadable) in Buenos Aires Province.
These scripts converted the extracted data into a structured format and
organized them into Python dictionaries for ease of further analysis. The
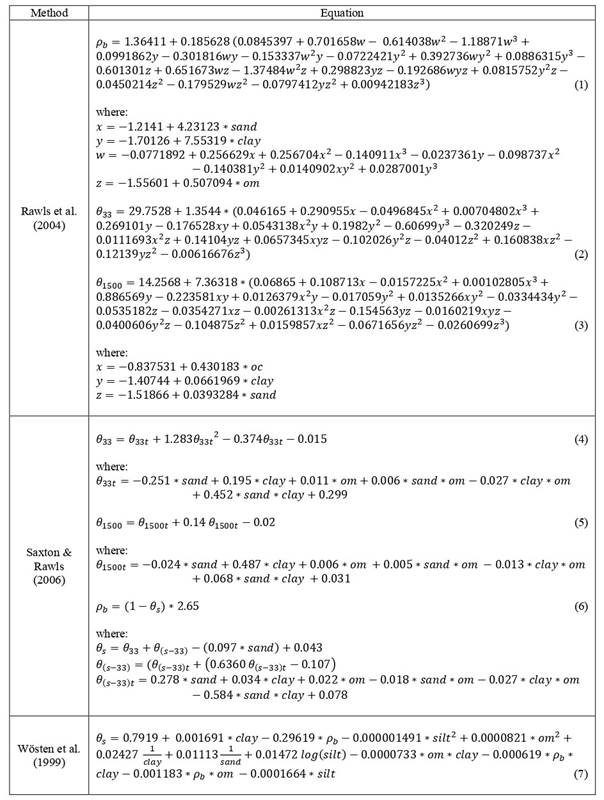
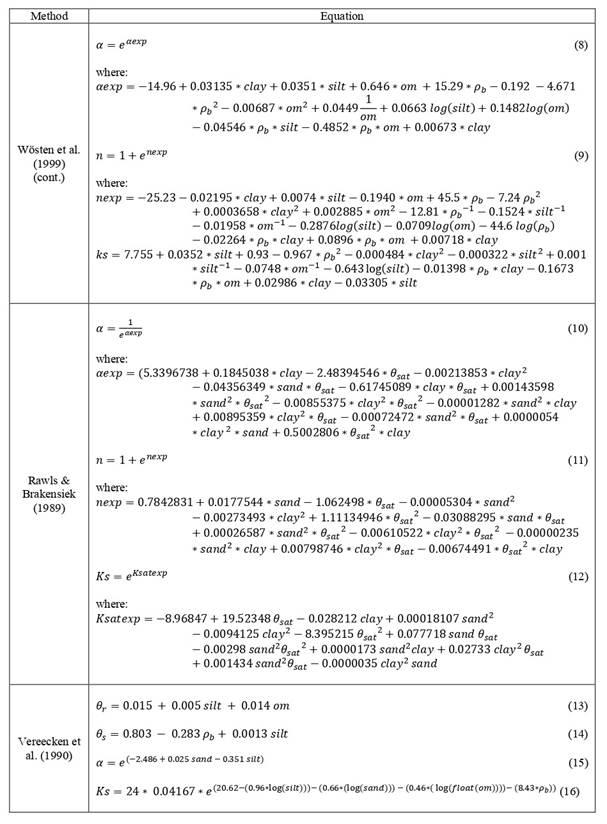
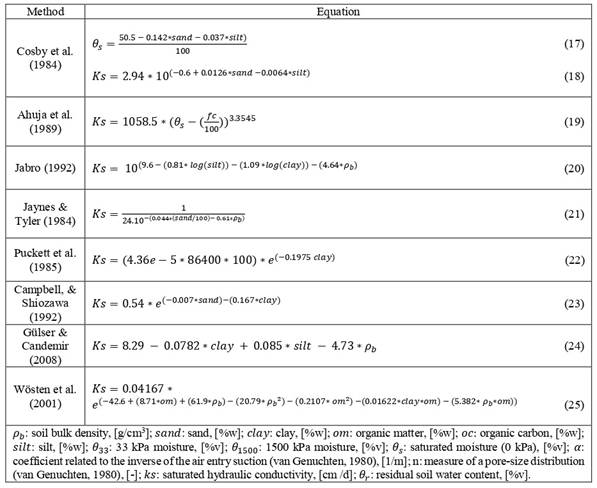
resulting robust database includes hydraulic parameters estimated using
pedotransfer functions, as detailed in Table 1. This digital database is now
ready for integration into hydrological and soil modeling applications.
Calibrated control points
The data considered as observed were obtained from two doctoral thesis
from the “Dr. Eduardo Usunoff” Instituto de Hidrología de Llanuras (IHLLA). In Mujica (2020), the measurements were performed as follows:
The textural class of each horizon was obtained using the hydrometer
method (Bouyoucos, 1962), whereas bulk density was found by weighing samples of
undisturbed soil cylinders (169.65 cm3, after drying them for 24 h
at 105°C). In addition, pH and electrical conductivity (EC) were measured on
samples corresponding to each of the horizons. These measurements were
performed on the supernatant of dilutions with a soil: water ratio of 1:2.5,
previously shaken (6 h), using an OAKTON PC700 reader with a pH probe
Cole-Palmer 05992-62 and EC-temperature probe 35608-74 (Chapter 3). The
parameters for the van Genuchten model (van Genuchten, 1980) were calibrated
using the MIN3P model (Bea et al., 2012; Mayer et al., 2002) from hydrological
data measured in the study plots (continuous soil moisture, transpiration,
precipitation, and soil temperature).
Weinzettel (2005) obtained the parameters in the field as follows:
In the superficial part of the soil, a tension infiltration meter was
used specially to evaluate certain hydraulic parameters of the soil, such as
the saturated hydraulic conductivity and the hydraulic conductivity at
different tensions close to saturation, as well as to evaluate the presence of
soil macroporosity. It was also used to evaluate the presence of soil
macroporosity (Chapter 3).
To obtain the K(θ) functions of each plot, internal drainage tests or instantaneous
profile method (Hillel et al., 1972). The test requires periodic measurements
of moisture and hydraulic potential at different depths while water drains from
the previously saturated soil, without evapotranspiration (Chapter 4).
Points used for calibration (Longitude, Latitude, INTA Soil Series): P1 (-57.83°, -36.1°, Los Naranjos), P2 (-58.906°, -37.498°, Tandil),
P3 (-0.063°, -37.155°, Mar del Plata), P4 (-59.654°, -36.947°, Tandil) (Mujica,
2020); P5 (-59.883°, -36.767°, Gral. Guido), P6 (-59.866°, -36.622°, Blanca
Chica), P7 (-59.93°, -37.001°, Mar del Plata) (Weinzettel, 2005).
Quantitative
Evaluation
The data from
the seven calibration sites encompassing all depths were grouped by calculated
variables: bulk density (ρb), saturated conductivity (Ks),
van Genuchten model exponent (n) and the alpha parameter of soil water
retention (α), the saturated water content (θs), the residual water
content (θr), wilting
point (θ1500), and field
capacity (θ33); classified
according to the functions utilized as shown in Table 1 and the Rosetta model,
that implements artificial neural network for five PTFs in a so-called
hierarchical approach. Rosetta model estimates Ks, n and α (Schaap,
2004), was implemented through a Python package (Skaggs, n.d.) which was
executed twice. First, using the parameters ρb, θ1500, and θ33 obtained
through the formulas of Rawls (Rawls et al., 2004), and second, using those
derived from Saxton's formulas (Saxton & Rawls, 2006).
For each group,
residuals were computed, and statistical metrics such as standard deviation,
Pearson’s correlation coefficient, and reference standard deviation (based on
observed values) were calculated. The analysis employed the geometric
relationships illustrated in the Taylor Diagram, which visually integrates
these metrics, enabling a comprehensive evaluation of the model performance and
the development of balanced skill scores that capture multiple dimensions of
accuracy (Taylor, 2001).
RESULTS
AND DISCUSSION
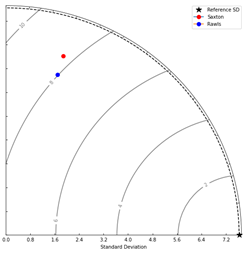
The
evaluation of model performance across variables revealed significant
variability. For the ρb, 64 modeled values and 32
observed values were analyzed. The observed standard deviation (0.2626)
exceeded those modeled by Saxton (0.1555) and Rawls (0.1167), which also showed
low correlations of 0.1091 and 0.4673, respectively. Rawls performed the best
(Figure 2). For Ks, none of the models captured observed variability (60.2092).
A total of 436 modeled values and 31 observed values were analyzed. Among them,
Saxton and Vereecken (Vereecken et al., 1990) achieved the highest correlations
(0.5865 and 0.4606, respectively) but underestimated the standard deviation
(18.0016 and 10.8391, respectively), Saxton performed the best (Figure 3). For
the 87 calculated values and 25 measured values of the parameter n, only Rawls
and Brakensiek (Rawls and Brakensiek, 1989) exceeded the observed standard
deviation (0.1051) with a value of 0.3123, although it showed a low correlation
of 0.1232. The other models demonstrated correlations below 0.2, and performed
similar and better (Figure 4). For the 137 calculated values and 31 observed
values of the parameter α, Wösten et al. (1999) and Vereecken produced the
highest correlations (0.1349 and 0.1868, respectively), although their standard
deviations deviated considerably from the observed value (0.0050), Wösten performed
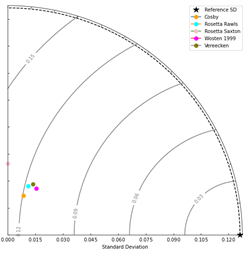
the worst and Vereecken the best (Figure 5). For θs,
Wösten demonstrated the strongest correlation (0.5165), followed by Vereecken
(0.4386), despite neither replicating the observed variability (0.1262). The
analysis was based on 144 calculated values and 32 observed values, all models
with similar performance, and Rosetta Saxton the worst (Figure 6). For θr,
Rosetta Saxton demonstrated the strongest correlation (0.4117), followed by
Rosetta Rawls (0.4067), despite neither replicating the observed variability
(0.0599). The analysis was based on 160 calculated values and 32 observed
values, both Rosetta performed the best (Figure 7). For θ33,
both Saxton and Rawls achieved standard deviations (6.0028 and 1.6959,
respectively) closer to the observed value (15.1958) but exhibited weak
correlations (0.0199 and 0.2574, respectively). The analysis included 64
calculated values and 32 observed values; Rawls performed better than Saxton
(Figure 8). Lastly, for θ1500, Saxton and Rawls
demonstrated comparable correlations (0.2982 and 0.2988, respectively) and
standard deviations (6.2997 and 5.6546, respectively) that were close to the
observed variability (7.6369). This analysis also included 64 calculated values
and 32 observed values, Rawls performed better than Saxton (Figure 9). Overall,
the analysis underscores substantial differences in model performance, with
specific models excelling in certain metrics, but none achieving a
comprehensive representation across all variables. It should be noted that here
we are evaluating a set of pedotransfer functions applied to a coarse soil
dataset (INTA Soil Series) against in situ data, so high accuracy of results
can't be expected. On the other hand, the INTA soil series data are very
valuable for the application of hydrological modelling where soil data are not
available.
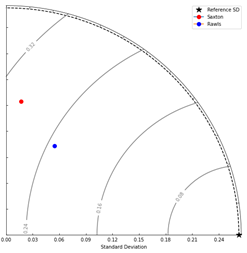
Figure 2. ρb model
performance at 7 locations across all depths.
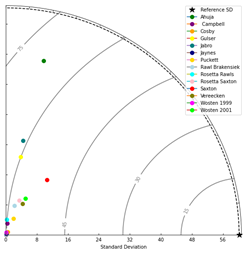
Figure 3. Ks model performance at 7
locations across all depths.
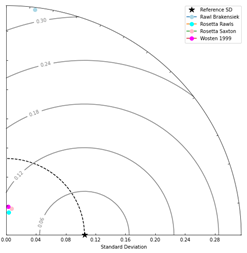
Figure 4. n model performance at 7 locations across
all depths.
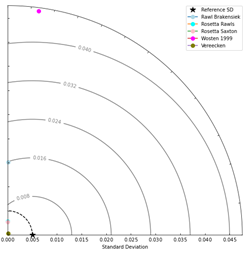
Figure 5. α model performance at 7 locations across all
depths.
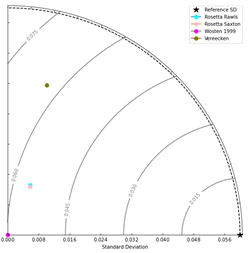
Figure 7. θr model
performance at 7 locations across all depths.
Figure
9. θ1500 model performance at 7 locations
across all depths.
Figure
6. θs model performance at 7 locations across all depths.
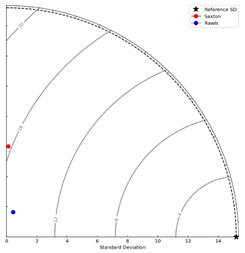
Figure 8. θ33 model performance at 7 locations across all depths.
CONCLUSIONS
The results show that the models evaluated have
difficulty fully replicating the observed variability in the variables. In most
cases, low Pearson correlation coefficients (r) indicate a weak relationship
between the modeled and observed values, which limits the predictive accuracy
of the models. Taylor diagrams are a powerful tool for visually assessing
statistical metrics that quantify model performance and have been key in
evaluating models by comparing their ability to replicate observed variability.
This study could benefit from an increase in observed measurements,
which would improve the evaluation tools and provide greater robustness to the
analysis. In summary, the model selection should be based on the specific
performance of each model for each variable, adjusting the choice according to
the particular characteristics of the variables.
ACKNOWLEDGEMENTS
We express our deep
gratitude to the “Dr. Eduardo Jorge Usunoff” Instituto de Hidrología de
Llanuras (IHLLA) and the Consejo Nacional de Investigaciones Científicas y
Técnicas (CONICET) for their invaluable support throughout this research.
REFERENCES
Ahuja, L. R., Cassel, D. K., Bruce, R. R. & Barnes, B. B. (1989).
Evaluation of spatial distribution of hydraulic conductivity using effective
porosity data. Soil Science, 148(6), 404–411. https://doi.org/10.1097/00010694-198912000-00002
Barranquero, R. S., Varni, M., Ruiz de
Galarreta, A. & Banda Noriega, R. (14-15 de junio de 2012). Evaluación de las características del agua
subterránea en la cuenca del arroyo Langueyú, Tandil, Buenos Aires, Argentina.
1er Encuentro de investigadores en Formación en Recursos Hídricos. Ezeiza,
Buenos Aires, Argentina.
https://www.researchgate.net/publication/319621092_Evaluacion_de_las_caracteristicas_del_agua_subterranea_en_la_cuenca_del_arroyo_Langueyu_Tandil_Buenos_Aires_Argentina
Bea, S. A., Wilson,
S. A., Mayer, K. U., Dipple, G. M., Power, I. M. & Gamazo, P. (2012).
Reactive Transport Modeling of Natural Carbon Sequestration in Ultramafic Mine
Tailings. Vadose Zone Journal, 11(2),
vzj2011.0053. https://doi.org/10.2136/vzj2011.0053
Bouyoucos, G. J.
(1962). Hydrometer Method Improved for
Making Particle Size Analyses of Soils1. Agronomy Journal, 54(5), 464–465. https://doi.org/10.2134/agronj1962.00021962005400050028x
Burgos, J. J. &
Vidal, A. L. (1951). The Climates of the Argentine Retublic According to the
New Thornthmaite Classification. Annals
of the Association of American Geographers, 41(3), 237–263. https://doi.org/10.1080/00045605109352055
Campbell, G. S.
& Shiozawa, S. (1992). Prediction of hydraulic properties of soils using
particle-size distribution and bulk density data. In M. T. Van Genuchten, F. J.
Leij and L. J. Lund (Eds.), Indirect Methods for Estimating the Hydraulic
Properties of Unsaturated Soils: Proceedings of the International Workshop on
Indirect Methods for Estimating the Hydraulic Properties of Unsaturated Soils,
Riverside, California, October 11-13, 1989 (pp. 317–328). U. S. Salinity
Laboratory, Agricultural Research Service, U. S. Department of Agriculture. https://books.google.com.ar/books?id=smVRAAAAMAAJ
Cosby, B. J.,
Hornberger, G. M., Clapp, R. B. & Ginn, T. R. (1984). A Statistical
Exploration of the Relationships of Soil Moisture Characteristics to the
Physical Properties of Soils. Water
Resources Research, 20(6), 682–690. https://doi.org/10.1029/WR020i006p00682
Damiano, F. &
Taboada, M. A. (2000). Prediccion
del agua disponible usando funciones de pedo-transferencia en suelos agricolas
de la region pampeana. Ciencia del suelo
18(2), 77–88.
https://suelos.org.ar/publicaciones/vol_18n2/damiano_77-88.pdf
Golin, A.
S., Páez Campos, H. R., Guevara Ochoa, C., Dávila, C. F. & Vives, L. S.
(2024). Assessing open-access digital elevation models for
hydrological applications in a large scale plain: Drainage networks, shallow
water bodies and vertical accuracy. Earth
Surface Processes and Landforms, 49(15), 5269–5283. https://doi.org/10.1002/esp.6035
Gülser, C. &
Candemir, F. (2008). Prediction of Saturated Hydraulic Conductivity Using Some
Moisture Constants and Soil Physical Properties. Proceeding Balwois, 1–5. https://www.researchgate.net/profile/Coskun-Guelser/publication/228839205_Prediction_of_Saturated_Hydraulic_Conductivity_Using_Some_Moisture_Constants_and_Soil_Physical_Properties/links/0c96053b16981075ab000000/Prediction-of-Saturated-Hydraulic-Conductivity-Using-Some-Moisture-Constants-and-Soil-Physical-Properties.pdf
Hillel, D.,
Krentos, V. D. & Stylianou, Y. (1972). Procedure and test of an internal
drainage method for measuring soil hydraulic characteristics in situ. Soil Science, 114(5), 395–400. https://doi.org/10.1097/00010694-197211000-00011
Instituto Nacional de Tecnología
Agropecuaria (2022, May 26). El INTA
digitaliza las cartas de suelos de la Provincia de Buenos Aires. INTA Informa. https://intainforma.inta.gob.ar/el-inta-digitaliza-las-cartas-de-suelos-de-la-provincia-de-buenos-aires/
Jabro, J. D.
(1992). Estimation of saturated hydraulic conductivity of soils from particle
size distribution and bulk density data. Transactions
of the American Society of Agricultural and Biological Engineers, 35(2),
557–560. https://doi.org/10.13031/2013.28633
Jaynes, D. B. &
Tyler, E. J. (1984). Using soil physical properties to estimate hydraulic
conductivity. Soil Science, 138(4), 298–305.
https://doi.org/10.1097/00010694-198410000-00007
Jobbágy, E. G. & Jackson, R. B. (2007). Groundwater and
soil chemical changes under phreatophytic tree plantations. Journal of Geophysical Research:
Biogeosciences, 112, G02013. https://doi.org/10.1029/2006JG000246
Jobbágy, E. G.,
Tóth, T., Nosetto, M. D. & Earman, S. (2017). On the Fundamental Causes of
High Environmental Alkalinity (pH ≥ 9): An Assessment of Its Drivers
and Global Distribution. Land Degradation & Development, 28(7), 1973–1981. https://doi.org/10.1002/ldr.2718
Lavado, R. S. &
Taboada, M. A. (2009). The Argentinean Pampas: A key region with a negative
nutrient balance and soil degradation needs better nutrient management and
conservation programs to sustain its future viability as a world agroresource. Journal of Soil and Water Conservation, 64(5),
150A–153A. https://doi.org/10.2489/jswc.64.5.150A
Mayer, K. U.,
Frind, E. O. & Blowes, D. W. (2002). Multicomponent reactive transport
modeling in variably saturated porous media using a generalized formulation for
kinetically controlled reactions. Water
Resources Research, 38(9), 1174. https://doi.org/10.1029/2001WR000862
Mujica, C. R.
(2020). Modelación numérica de los cambios hidrogeoquímicos en
la zona no saturada del suelo sometida a distintos usos primarios en la región
centro-sur bonaerense
[Tesis de doctorado, Facultad de Ciencias Agrarias y Forestales de la
Universidad Nacional de La Plata]. https://doi.org/10.13140/RG.2.2.26412.62085
Mujica, C. R., Bea, S. A., Jobbágy, E. G. (2021). Modeling
soil chemical changes induced by grassland afforestation in a sedimentary plain
with shallow groundwater. Geoderma, 400(2021),
115158. https://doi.org/10.1016/j.geoderma.2021.115158
Mujica, C. R., Milione, G. M., Bea, S. A. & Jobbágy, E.
G. (2019). Modelación de los cambios químicos en suelos inducidos por la
forestación de pastizales naturales en ecosistemas de llanura. Ecología Austral, 29(3), 433–445. https://doi.org/10.25260/EA.19.29.3.0.896
Oyarzabal, M., Clavijo,
J., Oakley, L., Biganzoli, F., Tognetti, P., Barberis, I., Maturo, H. M.,
Aragón, R., Campanello, P. I., Prado, D., Oesterheld, M. & León, R. J. C.
(2018). Unidades de vegetación
de la Argentina. Ecología Austral 28(1),
040–063. https://doi.org/10.25260/ea.18.28.1.0.399
Podestá, G. P., Messina, C. D., Grondona,
M. O. & Magrin, G. O. (1999). Associations
between Grain Crop Yields in Central-Eastern Argentina and El Niño–Southern
Oscillation. Journal of Applied
Meteorology, 38(1), 1488–1498. https://doi.org/10.1175/1520-0450(1999)038<1488:ABGCYI>2.0.CO;2
Puckett, W. E.,
Dane, J. H. & Hajek, B. F. (1985). Physical and Mineralogical Data to
Determine Soil Hydraulic Properties. Soil
Science Society of America Journal, 49(4), 831–836. https://doi.org/10.2136/sssaj1985.03615995004900040008x
Rawls, W. J. &
Brakensiek, D. L. (1989). Estimation of Soil Water Retention and Hydraulic
Properties. In H. J. Morel-Seytoux (Ed.), Unsaturated Flow in Hydrologic
Modeling. NATO ASI Series, Vol. 275. Springer, Dordrecht. https://doi.org/10.1007/978-94-009-2352-2_10
Rawls, W. J.,
Nemes, A., Pachepsky & Ya. (2004). Effect of soil organic carbon on soil
hydraulic properties. Development in Soil
Science, 30(2004), 95–114. https://doi.org/10.1016/S0166-2481(04)30006-1
Saxton, K. E. &
Rawls, W. J. (2006). Soil Water Characteristic Estimates by Texture and Organic
Matter for Hydrologic Solutions. Soil
Science Society of America Journal, 70(5), 1569–1578. https://doi.org/10.2136/sssaj2005.0117
Schaap, M. G.
(2004). Graphic user interfaces for pedotransfer functions. Developments in Soil Science, 30(2004),
349–356. https://doi.org/10.1016/S0166-2481(04)30019-X
Skaggs, T. H.
(n.d.). Rosetta soil. GitHub.
Retrieved January 2024 from https://github.com/usda-ars-ussl/rosetta-soil?tab=readme-ov-file
Soriano, A. (1992). Río de la Plata grasslands. In R. T. Coupland (Ed.), Natural
grasslands: introduction and western hemisphere (pp. 367–407). Elsevier. https://cir.nii.ac.jp/crid/1570854175783394048
Sun, J., Wang, G., Sun, X., Sun, S.,
Guo, L., Hu, Z., Song, C. & Lin, S. (2024). Soil water dynamics and plant
water uptake: Primeval mature vs. debris flow-developed half-mature subalpine
fir stands in the eastern Tibetan Plateau. Science
of the Total Environment, 951(2024), 175437. https://doi.org/10.1016/J.SCITOTENV.2024.175437
Taylor, K. E. (2001). Summarizing multiple aspects of model performance in a single diagram. Journal
of Geophysical Research: Atmospheres, 106(D7), 7183–7192. https://doi.org/10.1029/2000JD900719
Teruggi, M. E. (1957). The Nature and Origin of Argentine Loess. Journal of Sedimentary Research, 27(3),
322–332. https://doi.org/10.1306/74D706DC-2B21-11D7-8648000102C1865D
van Genuchten, M.
T. (1980). A closed-form equation for predicting the hydraulic conductivity of
unsaturated soils. Soil Science Society of America Journal, 44(5),
892–898. https://doi.org/10.2136/sssaj1980.03615995004400050002x
Varni, M. R. &
Usunoff, E. J. (1999). Simulation of regional-scale groundwater flow in the
Azul River basin, Buenos Aires Province, Argentina. Hydrogeology Journal, 7, 180–187. https://doi.org/10.1007/s100400050190
Vereecken, H.,
Maes, J. & Feyen, J. (1990). Estimating unsaturated hydraulic conductivity
from easily measured soil properties. Soil Science, 149(1), 1–12. https://doi.org/10.1097/00010694-199001000-00001
Weinzettel, P. (2005). Hidrodinámica de la zona no saturada en suelos argiudoles de la cuenca
del arroyo Azul. [Tesis de doctorado no publicada]. Universidad Nacional
del Sur.
Wösten, J. H. M., Lilly, A., Nemes, A.
& Le Bas, C. (1999). Development and use
of a database of hydraulic properties of European soils. Geoderma, 90(3–4), 169–185. https://doi.org/10.1016/S0016-7061(98)00132-3
Wösten, J. H. M., Pachepsky, Ya. A. &
Rawls, W. J. (2001). Pedotransfer
functions: Bridging the gap between available basic soil data and missing soil
hydraulic characteristics. Journal of Hydrology, 251(3–4), 123–150. https://doi.org/10.1016/S0022-1694(01)00464-4
Zárate, M. A.
(2003). Loess of southern South America. Quaternary
Science Reviews, 22(18–19), 1987–2006. https://doi.org/10.1016/S0277-3791(03)00165-3
Zárate, M. A.,
Tripaldi, A. (2012). The aeolian system of central Argentina. Aeolian Research, 3(4), 401–417. https://doi.org/10.1016/j.aeolia.2011.08.002
Zimmermann, E. D. & Basile, P. A. (2007, May 15). Funciones hidráulicas de suelos limosos: regresiones no lineales
con propiedades físicas y granulométricas. XXIº Congreso Nacional del Agua, San Miguel de
Tucumán, Argentina. https://www.fceia.unr.edu.ar/curiham/es/wp-content/uploads/2018/11/con10-CNA071.pdf
Zimmermann, E. D.
& Basile, P. A. (2008). Uso
de funciones de pedotransferencia para la estimación de parámetros hidráulicos
en suelos limosos (Llanura Argentina). Boletín
geológico y minero, 119(1), 71–80.
https://web.igme.es/boletin/2008/119_1_2008/ARTICULO%206.pdf
Zimmermann, E. D.
& Basile, P. A. (2011). Estimación de parámetros
hidráulicos en suelos limosos mediante diferentes funciones de
pedotransferencia. Tecnología y ciencias del agua, 2(1), 99-116.
https://www.scielo.org.mx/scielo.php?pid=S2007-24222011000100007&script=sci_arttext
Type of Publication: ARTICLE.
Work
received on 26/12/2024, approved for publication on 03/02/2025 and published on
28/02/2025.
HOW TO CITE
Golin, A. S., Mujica, C. R
& Villanueva, I. (2025). Soil hydraulic properties database of the Pampas
Region in Buenos Aires Province. Cuadernos del CURIHAM, Edición Especial
(2024): 40 Años del IHLLA. e09. https://doi.org/10.35305/curiham.ed24.e09