Figure 1: Location and geomorphologic units of the study area.
MULTI-TEMPORAL FLOOD MAPPING AND FARM FLOOD
PREVENTION STRATEGIES IN AN AGRICULTURALLY DOMINATED WATERSHED OF ARGENTINA
CARTOGRAFÍA MULTITEMPORAL Y ESTRATEGIAS PARA LA PREVENCIÓN DE INUNDACIONES
EN UNA CUENCA CON PREDOMINIO AGRÍCOLA DE ARGENTINA
María Ximena Solana (1), Asunción Romanelli (2) y Orlando Mauricio Quiroz
Londoño (3)
Instituto de Investigaciones Marinas y Costeras, Consejo Nacional de Investigaciones Científicas y Técnicas, Facultad de Ciencias Exactas y Naturales; e Instituto de Geología de Costas y del Cuaternario, Universidad Nacional de Mar del Plata – Comisión de Investigaciones Científicas Provincia de Buenos Aires, Facultad de Ciencias Exactas y Naturales, Mar del Plata, Argentina.
(1) e-mail: ximenasolana@mdp.edu.ar. ORCID: https://orcid.org/0000-0002-4575-6990
(2) e-mail: aromanel@mdp.edu.ar. ORCID: https://orcid.org/0000-0002-9003-396X
(3) e-mail: qlondono@mdp.edu.ar. ORCID: https://orcid.org/0000-0002-2817-9570
ABSTRACT
This study presents a semi-automated
approach for mapping the extent and frequency of floods in agriculturally dominated river watersheds, using the
Quequén Grande River watershed as a case study. By the combination of
normalized difference indices computed from Landsat imagery and the application
of Otsu’s thresholding method in Google Earth Engine (GEE) environment, two
flood categories were defined: Open Flood Surfaces (OFS) and Flooded Vegetation
(FV). The analysis of historical flood frequency allowed the proposal of flood
prevention strategies to be implemented in each defined flood frequency class,
which is essential for flood mitigation in agriculturally dominated river
watersheds.
Keywords: Google
Earth Engine, Landsat Imagery, Spectral Indices, Flood Mapping, Flood
Prevention Strategies.
RESUMEN
En este estudio se propone un método semiautomático para la cartografía de la extensión y frecuencia de las inundaciones en una cuenca hidrográfica con predominio agrícola, seleccionándose la cuenca del Río Quequén Grande como caso de estudio. Mediante la combinación de índices diferenciales normalizados calculados a partir de imágenes Landsat y la aplicación del método de umbralización desarrollado por Otsu en el entorno de Google Earth Engine (GEE), se definieron dos categorías para las inundaciones: superficies de inundación abiertas (OFS) y vegetación inundada (FV). El análisis de la frecuencia histórica de las inundaciones permitió la propuesta de estrategias de prevención a las inundaciones dirigidas a ser implementadas en cada clase de frecuencia de inundación definida, siendo esencial para la mitigación de inundaciones en cuencas hidrográficas con predominio agrícola.
Palabras clave: Google Earth Engine, Imágenes
Landsat, Índices Espectrales, Cartografía de inundaciones, Estrategias
de Prevención a la Inundación.
INTRODUCTION
Flooding is an extended
natural hazard that affects the society of different parts of the world, and it
is considered the most recurring and devastating problem from its impact on the
economic and social conditions of human lives (Alderman et al., 2012; Wannous &
Velasquez, 2017). The influence of human activity also enhances the severity
and consequences of flooding events, which are generated by the arbitrary
coincidence of different meteorological factors (Feloni et al., 2019). Global
climatic change, land-use changes, and accelerated urbanization are
intensifying flood events worldwide, independently of their topographic and meteorological
context (Dash & Sar, 2020; Detrembleur et al., 2015; Du et al., 2015).
Predicting the potential
flood inundation extent (i.e.,
identifying areas susceptible to flooding) of heavy rainfall events is
critical, particularly in developing countries where the effects of floods are
severely felt (Dash & Sar, 2020). However, in most of these countries, the
accessibility of flood inundation extent maps is scarce, and those existing are
outdated and have a low spatio-temporal resolution (Mehmood et al., 2021). In
Latin America and the Caribbean region (LAC) floods are the most common
disaster, with 548 floods occurring since 2000 (UN-OCHA, 2020). Here, the
intensification of flood consequences is expected due to several socio-economic
and political factors such as inefficient public policies, infrastructural
problems, poverty persistence, ineffective emergency response to flooding
events, unregulated and exponential urbanization of floodplains, anthropogenic
degradation of catchments, and the lack of flood data (Sandoval &
Sarmiento, 2020; UN-OCHA, 2020).
Over the last decade,
there has been a proliferation of Earth Observations (EO) data. The global open
data access from operational satellites like the Landsat series, together with
important advances in cloud computing, have made possible the cartography of
inundation over increasingly larger scales (DeVries et al., 2020; Hawker et
al., 2020; Mehmood et al., 2021), and at relatively high spatio-temporal
resolution (Wulder & Coops, 2014). Particularly, the cloud-based platform
Google Earth Engine (GEE) stands out. It was introduced by Google Inc. for
planetary-scale geospatial analysis and provides free access to
high-performance computing resources, allowing the processing of extensive
geospatial datasets (Gorelick et al., 2017). The development of this tool
represents a great opportunity for effective flood response interventions and
management plans, especially in under-resourced regions of the world with a
lack of information (Hawker et al., 2020). In the case of flood inundation
extent maps developed from satellite imagery, the creation of several
algorithms has been produced by different institutions such as universities,
space agencies, or companies directed to disaster recovery and response (DeVries
et al., 2020; Hawker et al., 2020; Mehmood et al., 2021; Policelli et al.,
2017). Specifically, for the Global South, most of the flood-related research
including the use of GEE for flood extent identification is associated with
South Asia (Kumar et al., 2022; Lal et al., 2020; Pandey et al., 2022; Vanama
et al., 2020), with very few studies in LAC countries (Mora et al., 2021;
Tellman et al., 2021).
In
Argentina, extreme precipitation events causing floods and droughts lead to the
country’s natural hazard risk profile. Floods have been responsible for causing
important economic losses since 1980, with an average of US $ 1 billion
annually (World Bank, 2021), and these losses could increase by 125% due to
climate change. Recently, historical increases in the frequency of flooding
linked to severe rainfall events highlighted the need for improved risk
management strategies. This behavior can be partially attributed to higher
average precipitation, land-use changes, and water table rising (Rozenberg et
al., 2021). In the case of very flat and poorly drained landscapes, the rise in
water tables causes floods linked to increased water storage, and after
reaching high levels water losses occur as liquid water outflows, in addition
to an increased evaporation rate (Fan et al., 2013; Kuppel et al., 2015).
The Argentine Pampa
region (east-central of the country), is a subhumid aeolian plain that
encompasses the most populated and productive sector of the country. Here, an
alternation of non-flooded and flooding cycles occurs and describes the
ephemeral nature of surface water coverage (Houspanossian et al., 2018), which
makes this region highly relevant for implementing flood mapping techniques.
During large episodic flood events, an important fraction of the sedimentary
Pampean Plain is covered by water for months or even years, on account of low
horizontal water transport caused by the low surface runoff and the slowness of
groundwater flow (Aragón et al., 2011). The hydrological conditions of these
very flat regions must be considered carefully when land management strategies
are implemented (Kuppel et al., 2015), especially because there is an expected
intensification of farming at such arable lands since global food demand and
trade are increasing (Paruelo et al., 2005).
This article presents a
semi-automatic methodology for mapping the spatial extent and frequency of
flooding in agriculturally dominated plain environments. Based on spectral
indices computed at the GEE platform, our approach aims to generate historical
flood frequency maps from past flood events that occurred between 2000 and
2020. Additionally, the proposed approach gives some advances in the detection
and extraction not only of open flood surfaces but also of flooded areas
underneath vegetation (i.e., flooded vegetation), which is of particular
importance for flood monitoring and assessment. By conducting a comprehensive
multi-temporal assessment of floods in an agriculturally dominated watershed,
we sought to achieve the following results: i) identify areas with a history of
frequent flooding, providing critical information to authorities and farmers
regarding the flood-prone regions within the area, and ii) enable action
guidelines for private landowners and agricultural producers to reduce the extent
and impact of flood-related damage.
STUDY AREA
To analyze the
usefulness of the generated algorithm, a representative plain river watershed
of the Pampa Region is proposed as a case study. The Quequén Grande River
Watershed (QGRW) is an extensive river catchment located in an
agricultural-livestock area of great economic importance for the country, with
several small and medium-sized cities. Towards the southwest of the Tandilia
Range System (TS), the origin of the Quequén Grande River (QGR) is marked by an
undulating plain with a dominant northwest-southeast slope called “Pampa de
Juárez”, and flows to the southeast across the Pampean Plain, reaching the
Atlantic Ocean near Necochea city (Campo de Ferreras & Piccolo, 1999).
Tributaries of this main water course are small streams developed almost
exclusively from its right bank (Marini & Piccolo, 2005). From the
hydrological point of view, this catchment belongs to a temperate climate zone
where the mean annual precipitation in the basin is about 800 mm. However, the
area is characterized by climatic oscillations and instabilities, with a
history of both floods and drought periods.
The QGRW comprises six
geomorphological units, i.e., ranges,
perirange aeolian hills, relic hills, alluvial plain, poor drainage alluvial
plain, and hills with shallow lakes (Teruggi et al., 2005) (Figure 1). Here, agriculture
predominates over livestock farming, especially through the cultivation of
wheat, natural pastures, and winter fodder cereals (Campo de Ferreras &
Piccolo, 1999). The QGRW covers a surface of about 11000 km2 and
most of it consists of an essentially flat plain with a topographic average
gradient of 0.03 (Teruggi et al., 2005). In the north part of the catchment
area, a small sector is taken up by low-relief ranges (maximum elevation = 510
m a.s.l.) corresponding to the TS.
Hydrogeologically,
the loess sediments of the Pampean Plain constitute an aquifer of great
importance for the country, ranging between 70 -100 m in thickness. This
hydrogeological sequence represents an unconfined, shallow, and multi-layer
aquifer, with permeability changes caused by subtle grain size and clay content
variations (Martínez & Bocanegra, 2002). Groundwater recharge of this area
is attributed mainly to precipitation, with groundwater discharge occurring
towards the Atlantic Ocean, the surface drainage network (i.e., rivers and streams), and the shallow lakes located at the
southwestern limit of the QGRW. Here, a hydraulic barrier to the Pampean
Aquifer has been proposed in-depth acting as a regional discharge area (Solana
et al., 2021a). Rivers and streams are primarily effluents along their course,
with south and/or southeast direction usually aligned to the groundwater flow
path. For the QGR, a base-flow estimation of 70-90% was obtained (Martínez et
al., 2010).
MATERIALS AND METHODS
The proposed flood mapping code was
developed in the GEE JavaScript API. This algorithm generates a stack of
spatially overlapped pixels classified as water/non-water corresponding to the
rainiest years between 2000 and 2020. Surface water changes were analyzed at
the GEE platform by processing freely-available Surface Reflectance (SR) cloud
products of Landsat 5 TM, Landsat 7 ETM+, and Landsat 8 OLI/TIRS imagery. To
exclude permanent water bodies from flooded areas, the driest year of this
period was also analyzed, and permanent water bodies (i.e., rivers, streams, and shallow lakes) were masked. Water detection was achieved by the combination of
two normalized difference indices: the Modified Normalized Difference Water
Index (MNDWI; Xu, 2006) and the Normalized Difference Vegetation Index (NDVI;
Tucker, 1979). Then, Above-Ground Water Presence Frequency (AWPF) maps were
obtained following Borro et al. (2014). The proposed code consists of five
steps: (1) free data selection from cloud servers, (2) pre-processing of
Landsat imagery, (3) normalized difference indices computation and dynamic
segmentation, (4) water detection, (5) multi-temporal flood analysis, and (6)
mapping of flooding frequency. The methodological framework is shown in Figure 2. The generated GEE
JavaScript codes for multi-temporal flood analysis and mapping of flooding
frequency are provided in Data Availability.
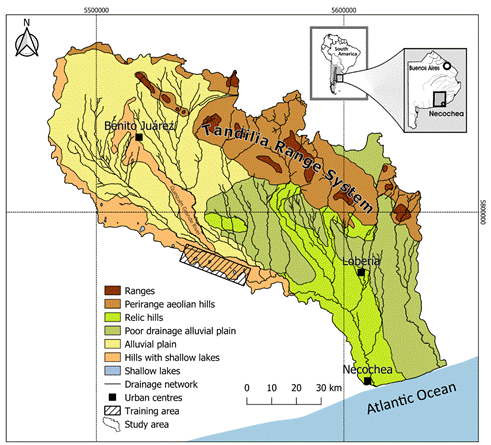
Figure 1: Location and geomorphologic units of the study area.
Data selection
To evaluate rainfall trends in the
study area, precipitation data from the last 60 years were reviewed. Time
series of daily rainfall data (mm/day) within the influence area of the QGRW
were extracted from national and local weather stations (National Institute of
Agricultural Technology-INTA, Meteorological National Service-SMN, National
University of Mar del Plata-UNMdP). All rainfall time series from the period
were analyzed and processed to obtain both a monthly mean value and an annual
total value per year. Finally, those years between 2000 and 2020 with annual
rainfall values reaching one standard deviation above the mean precipitation
value of the last 60 years were selected as target years for flooding mapping.
Additionally, the driest year of this period (i.e., 2009) was selected for the generation of an exclusion mask of
permanent water bodies from flooded areas. Regarding remote sensing data, SR
cloud products from Landsat 5 TM, Landsat 7 ETM+, and Landsat 8 OLI/TIRS were
selected from the Earth Engine Data Catalog.
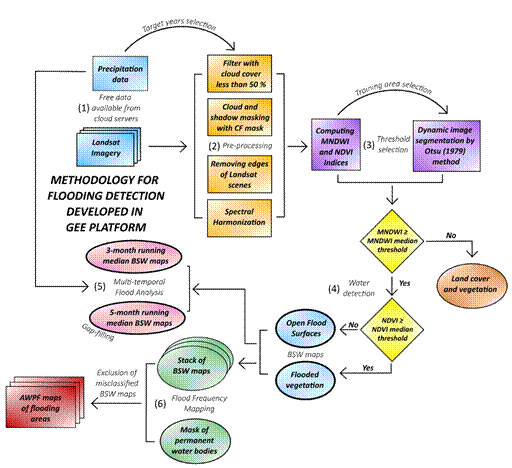
Figure 2: Schematic workflow of the flood extension and frequency
mapping, developed in the GEE environment. Each of the six steps is indicated
by parentheses.
Pre-processing of Landsat imagery
Landsat satellite imagery was
initially filtered by a cloud cover of less than 50%. Then, shadow and cloud
masking were performed using the pixel quality assurance band (qa) with the C
Function of Mask (CFMask) algorithm. The CFMask series of algorithms are
recommended for the operational detection of clouds and cloud shadows at the
Landsat series, as they are based on a previous understanding of such physical
phenomena and can be implemented with no geographical restrictions (Foga et
al., 2017). Additionally, scene edges of all datasets were removed by clipping
a buffer of 500 m inward as a way to exclude no-data pixels such as
abnormalities along Landsat 5 scene edges (Robinson et al., 2017). Spectral
characteristics of Landsat datasets were also harmonized by a linear
transformation of OLI to TM /ETM+ spectral space following Roy et al. (2016),
in order to improve temporal continuity between sensors.
Normalized difference indices computation and dynamic segmentation
The two normalized difference
indices selected for water detection were computed by the following equations:
![]() (1)
(1)
Where NIR: near-infrared band
and R: red band.
![]() (2)
(2)
Where G: green band and SWIR:
short-wave infrared band.
The segmentation threshold of each
index was estimated by the Otsu (1979) method for a training area where
differences between land, vegetation, and water can be easily distinguished.
This dynamic method was selected since it automatically selects a threshold
from two mixed distributions through the density histogram, which eliminates
the bias caused by arbitrary thresholding methods. For the selected time-lapse
collection, median threshold values were determined because they represent
points where the sums of the distances from the representative points of the
sample are a minimum (Haldane, 1948). Once obtained, NDVI and MNDWI median
thresholds were applied to the entire study area.
Water detection
By the calculation [equations (1)
and (2)] and combination of the selected indices, more accurately flooded
surface detection was achieved. Firstly, pixels with MNDWI values above the
median threshold were identified as water. Then, an additional filter with NDVI
values was applied to the pixel selection of MNDWI for each Landsat scene, in
order to discern between open water surfaces and flooded vegetation. The
proposed sub-selection was based on the NDVI response to inundation since areas
adapted to flood pulses are highly responsive, showing increases and peaks in
NDVI values (Powell et al., 2014). Finally, two categories were defined as
follows:
a.
Open Flood
Surfaces (OFS): represented by pixels with MNDWI values above the median
threshold and NDVI values below the median threshold. This category corresponds
mainly to wetlands, ponds, rivers, streams, and open water surfaces.
b. Flooded vegetation (FV): represented by pixels with
MNDWI and NDVI values above median thresholds. In the scope of this paper, the
term FV describes the temporary or permanent occurrence of a water surface
beneath vegetated areas (Tsyganskaya et al., 2018). It corresponds to wetland
vegetated areas, floodplains, and surrounding stream areas covered by water
during inundation events.
Flooding evolution analysis
After OFS and
FV detection of the selected Landsat scenes, Binary Surface Water (BSW) maps
corresponding to each category were obtained. Multi-temporal flood analysis was
performed quarterly by running time-lapse collections of Landsat images and
computing median BSW maps, since almost all the pixels of the QGRW surface were
covered successfully after cloud masking (QGRW surface covered accuracy of
about 99%). The selection of the quarterly multi-temporal flood analysis was
based on the accuracy of the proposed algorithm at different time-lapse windows
(i.e., monthly, bimonthly, and
quarterly). To achieve better results, a cut-off tolerance threshold value of 1
was set, i.e., the total number of
flooding maps obtained for the QGRW with a surface-covered accuracy lower than
80%, which was obtained quarterly. Additionally, pixels with no data values
were filled by median BSW values of an additional 5-month running time-lapse collection
of Landsat images.
Mapping of flooding frequency
Annual flooding frequency was
analyzed in each pixel of the QGRW using the entire Landsat collection of the
target years. The applied methodology was based on the procedure defined by
Borro et al. (2014), which is defined by the following equation:
![]() (3)
(3)
Where AWPFsj represents the
above ground water presence frequency value of the pixel j for the set s
and corresponds to the ratio of images i with BSW equal to 1 in
the pixel j (BSWij) of the total number of images in the analyzed
set (Ns). As a result, AWPF maps describing the water permanence degree
in each pixel were obtained, ranging from 0 (pixels equal to 0 in all BSW maps)
to 1 (pixels equal to 1 in all BSW maps). This methodology was successfully
applied by Solana et al. (2021b) for the water frequency classification of
shallow lakes located in the southwestern limit of the QGRW.
To exclude
permanent water bodies from flood mapping, an exclusion mask was generated by
the flooding frequency analysis of the driest year of this period (i.e., 2009). Only the pixels labeled as
permanent water (i.e., AWPF pixels
equal to 1 obtained for the driest year) have been included in the reference
water mask. In every pixel of the watershed, each flood category (i.e., Open Flood Surfaces -OFS- and
Flooded Vegetation -FV-) was classified according to the relative frequency of
occurrence of the flooded area. For this purpose, five flood frequency classes
were defined: Very Low (AWPF <
20%), Low (20% ≤ AWPF < 40%), Moderate (40% ≤ AWPF < 60%), High (60% ≤ AWPF < 80%), and Very High (AWPF ≥ 80%), taking as a reference the total number of handled images.
Here, the exclusion of some BSW maps from the GEE code was required, since some
Landsat scenes were affected by satellite malfunctions, and cloud shadows are
not always successfully removed by the CFMask algorithm. However,
excluded Landsat scenes from data processing only represented a small portion
(12%) of the evaluated dataset (619 images). Satellite data distortion problems
such as data loss are widely described on USGS official website (United State
Geological Survey [USGS], access date 08/05/2023).
Finally,
historical flood frequency maps were generated by combining all annual datasets
of OFS and FV categories, and classified according to the relative flood
frequency previously defined following Borro et al. (2014). Subsequently, a set
of flood prevention strategies was proposed for each specific frequency class.
These recommended measures are intended to assist farmers and landowners in
reducing flood-related damages on farmlands and agricultural landscapes,
safeguarding agricultural productivity and minimizing potential losses.
RESULTS
Rainfall analysis
Annual and
monthly average values of precipitation data are shown in Figure 3. In the case of total annual
precipitation, a mean value of 858 mm was obtained for the last 60 years,
showing a clear increasing tendency. In the case of monthly rainfall averages,
the mean value reached 74 mm, but the increasing tendency was less clear. The
greatest annual rainfall averages with values reaching one standard deviation (i.e., 161.4 mm) above mean
precipitation were obtained for 5 years. For those years, variations between
monthly average values and mean precipitation of each month registered during
the last 60 years showed, in most cases, average
rainfall values above mean monthly precipitation (Figure 3). This behavior was especially noticed during the
second half of the year. Moreover, four of the greatest annual rainfall years
showed similar rainfall averages in August, with a subsequent decrease in
September and a substantial increase in October and November.
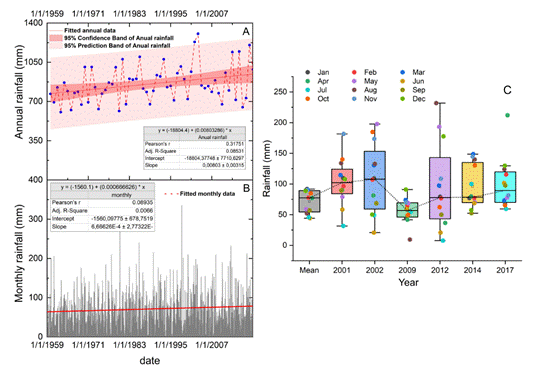
Figure 3: A) Annual and B) Monthly rainfall values between 1959 and 2020
for the study area. C) Box plots of monthly rainfall amounts in the target
years of the study and mean rainfall values for the period 1959-2020.
Changes in accumulated rainfall and flooded extension
Comparisons between quarterly
accumulated precipitation (mm), open flood surfaces (km2), and
flooded vegetation (km2) of the target years are shown in Figure 4.
Results indicated water and flooded vegetation increase during the cold months
of the winter (JJA, JAS), which can be attributed to the descent of
evapotranspiration. In the case of precipitation, an increase is observed
during the summer season, being the general tendency for the study area.
Furthermore, results obtained for the driest year of the selected time-lapse
window (2009) can be attributed to the permanent water bodies of the QGRW,
since flooded vegetation areas were almost absent.
The extreme
values of obtained Otsu’s median thresholds, the number of Landsat images used,
and the percentages of QGRW surface covered accuracy obtained at the
multi-temporal flood analysis, are shown in Table 1. In the case of the 3-month running time-lapse analysis, accuracy
was defined as the percentage of the total study area covered by the handled
quarterly Landsat collection, which was improved by the proposed gap-filling
method of an additional 5-month running time-lapse collection, reaching values
closer to 100% of accuracy.
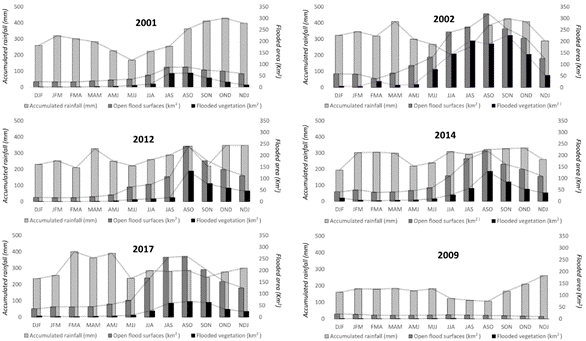
Figure 4:
Accumulated rainfall (mm), open flood surfaces extension (km2), and
flooded vegetation (km2) of the target years, expressed quarterly.
Table 1. Extreme values of Otsu’s median thresholds, number of Landsat
images, and percentages of accuracy obtained at the multi-temporal flood
analysis for each year.
|
Year |
Otsu's MNDWI |
Otsu's NDVI |
QuarterlyLandsat |
3-month |
Final |
|||||
|
median
thresholds |
median thresholds |
Collections (#) |
accuracy (%) |
accuracy (%) |
||||||
|
Min |
Max |
Min |
Max |
Min |
Max |
Min |
Max |
Min |
Max |
|
|
2001 |
-0.0393 |
0.0385 |
0.4139 |
0.4609 |
17 |
36 |
99.54 |
100.00 |
99.99 |
100.00 |
|
2002 |
-0.1175 |
0.0077 |
0.2733 |
0.5078 |
13 |
32 |
54.44 |
100.00 |
88.41 |
100.00 |
|
2009 |
-0.1020 |
-0.0073 |
0.3671 |
0.4766 |
8 |
39 |
51.24 |
100.00 |
99.34 |
100.00 |
|
2012 |
-0.1487 |
-0.0375 |
0.3356 |
0.5391 |
11 |
23 |
97.63 |
100.00 |
99.58 |
100.00 |
|
2014 |
-0.2577 |
-0.1794 |
0.3633 |
0.5391 |
21 |
45 |
99.98 |
100.00 |
99.99 |
100.00 |
|
2017 |
-0.2384 |
-0.1990 |
0.3633 |
0.5352 |
26 |
36 |
99.98 |
100.00 |
99.99 |
100.00 |
Annual flood frequency maps
AWPF maps
of the selected years corresponding to OFS and FV frequency are shown in Figure
5. In the case of 2002, obtained results showed the maximum flooding extension
(1398.84 km2), being specially noticed in the flooded vegetation
category (802.21 km2). This was also observed in Figure 4, where the
FV of 2002 showed an important increase, especially during the autumn season.
Moreover, FV areas were located primarily at the floodplains of rivers and
streams placed at the alluvial plain, which suggests an overflow caused by soil
water surplus generated in 2001, when soil water storage capacity reached its
limit of absorption and storage capacity (Quiroz Londoño et al., 2013; Scarpati
& Capriolo, 2013). In the case of 2014, the
OFS total extension (653.74 km2) was greater than the FV category
(297.22 km2). In regards to the driest year of the selected
time-lapse window (2009), water corresponded primarily to permanent shallow
lakes (8.51 km2), and FV (13.48 km2) was linked to the
OFS (58.18 km2) or some isolated croplands with a very low flooding
frequency. Flooding extension areas of each category of annual AWPF maps are
shown in Table 2.
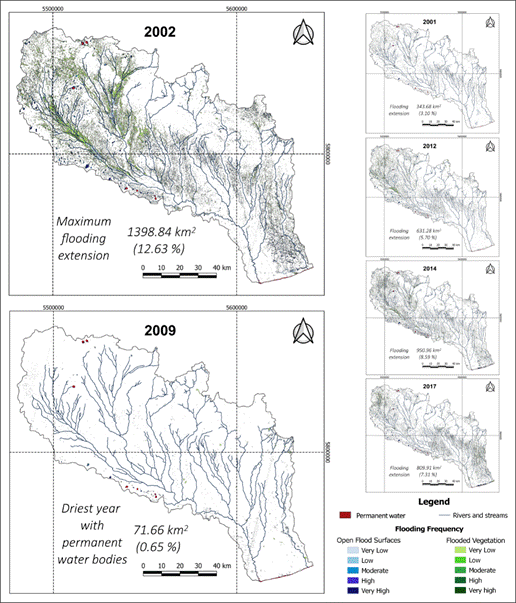
Figure 5: Flooding frequency in
the QGRW obtained from Landsat imagery at the GEE platform for the selected
years.
Table 2.
Flooding extension of the OFS and FV categories obtained for the QGRW from AWPF
maps shown in Figure 5.
|
Year |
Flooding Surfaces(km2) |
Handled Landsat |
Otsu's median |
|||||||||||
|
Open Flood Surfaces |
Flooded Vegetation |
Images (#) |
thresholds |
|||||||||||
|
Very |
Low |
Mode- |
High |
Very |
Very |
Low |
Mode- |
High |
Very |
Used |
Ex cluded |
MNDWI |
NDVI |
|
|
Low |
rate |
High |
Low |
rate |
High |
|||||||||
|
2001 |
216.4 |
24.4 |
6.0 |
4.7 |
19.8 |
70.7 |
1.6 |
0.02 |
- |
- |
94 |
10 |
0.0071 |
0.4610 |
|
2002 |
439.5 |
71.4 |
38.0 |
16.5 |
31.2 |
732.7 |
62.7 |
5.1 |
0.92 |
0.70 |
75 |
6 |
-0.0708 |
0.2735 |
|
2009 |
39.7 |
3.5 |
1.6 |
2.1 |
11.2 |
13.3 |
0.1 |
- |
0.02 |
- |
83 |
31 |
-0.0714 |
0.4141 |
|
2012 |
217.3 |
82.5 |
46.5 |
10.1 |
16.7 |
238.4 |
19.0 |
0.8 |
0.04 |
- |
62 |
5 |
-0.1327 |
0.4299 |
|
2014 |
492.2 |
88.5 |
31.5 |
11.7 |
29.8 |
293.8 |
3.1 |
0.3 |
0.02 |
- |
119 |
10 |
-0.2110 |
0.4414 |
|
2017 |
359.2 |
84.4 |
52.0 |
32.4 |
17.1 |
256.8 |
7.2 |
0.7 |
0.1 |
0.03 |
106 |
18 |
-0.2304 |
0.4336 |
Final flood frequency maps
AWPF final maps corresponding to OFS and FV categories are shown in
Figure 6. For the OFS category, all flooding frequencies were identified in the
final map, reaching a total area of 1116.18 km2 and corresponding
mainly to wetlands and ponds. In the case of FV, flooded areas were identified
with Very Low, Low and Moderate
frequencies of flooding, reaching a total area of 1520.29 km2
located mainly at the floodplains of rivers and streams.
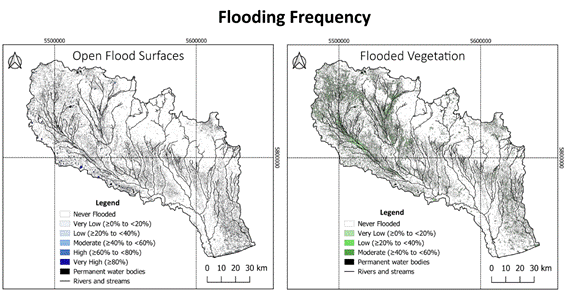
Figure 6: Final flood frequency maps obtained for the study area with
the selected time-lapse collection.
The
combination of historical OFS and FV binary maps, classified by the relative
flood frequency classes, is shown in Figure
7. According to the geomorphologic units of the QGRW, the alluvial plain
showed the maximum flooding extension (941.41 km2), reaching the
27.22% of the floodplains of rivers and streams (Table 3). Here, the FV
category generates the greatest flooding impact (71%), which is related to
overflows of the surrounding vegetated areas, corresponding mainly to the Very Low frequency class. In the poor
drainage alluvial plain, maximum flooding extension reaches 440.3 km2,
which represents the 17.40% of this geomorphologic unit, and it is more
represented by the OFS category (55%), corresponding to subcircular ponds with
sizes ranging from 0.014 to 1.10 km2 and minor ephemeral streams, as
observed by Teruggi et al. (2005). Similar results were obtained in the hills
with shallow lakes, with a maximum flooding extension of 195.49 km2
(17.14% of the hills extension) and represented mainly by the OFS category
(60%). Particularly in this area, the Very
High frequency class is better represented (9.88 km2), since
temporary water bodies related to the subsurface water flow emerge. In the case
of the relic hills and perirange aeolian hillocks, maximum flooding extension
was lower (92.11 km2 and 93.79 km2), covering the 5.91%
and the 4.45% of the total extension of the mentioned geomorphologic units,
respectively. Finally, as expected, flooding in the ranges was almost
negligible (7.98 km2, representing 2.88% of the range system).
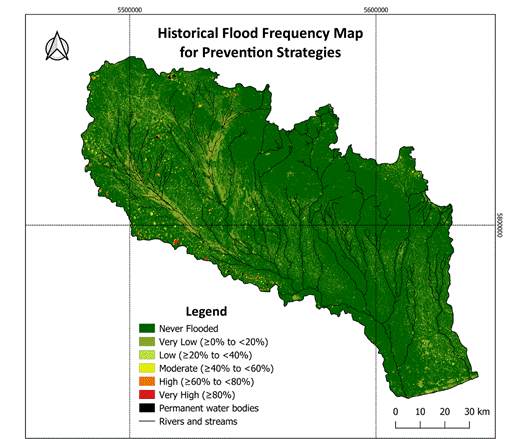
Table 3. Flood extension of the historical flood frequency obtained for
the geomorphologic units of the QGRW.
|
Geomorphologic unit |
Area (km2) |
Area (%) |
Flooding representation |
||||||||
|
Total area |
Not flooded |
Very Low |
Low |
Moderate |
High |
Very High |
TOTAL (Flooded) |
Flooded |
FV (%) |
OFS (%) |
|
|
Ranges |
277 |
269.1 |
7.89 |
0.09 |
- |
- |
- |
7.98 |
2.88 |
61 |
39 |
|
Perirange aeolian hills |
2110 |
2016.19 |
86.94 |
3.8 |
2.09 |
0.85 |
0.11 |
93.79 |
4.45 |
52 |
48 |
|
Relic hills |
1557 |
1465.44 |
82.36 |
6.77 |
1.8 |
0.68 |
0.5 |
92.11 |
5.91 |
39 |
61 |
|
Hills with shallow lakes |
1141 |
945.31 |
129.18 |
33.86 |
14.17 |
8.4 |
9.88 |
195.49 |
17.14 |
40 |
60 |
|
Alluvial plain |
3459 |
2517.41 |
879.65 |
45.16 |
9.23 |
4.55 |
2.82 |
941.41 |
27.22 |
71 |
29 |
|
Poor drainage alluvial plain |
2531 |
2090.6 |
370.06 |
53.97 |
13.97 |
1.87 |
0.43 |
440.3 |
17.4 |
45 |
55 |
|
TOTAL |
11075 |
9304.05 |
1556.08 |
143.65 |
41.26 |
16.35 |
13.74 |
1771.08 |
15.99 |
51 |
49 |
Flood prevention strategies
Farm flood
prevention strategies can vary depending on specific circumstances and
location. However, there are certain agricultural best management practices and
measures that each single landowner and agricultural producer can implement for
farm flood prevention (Antolini et al., 2020; European Commission -
Directorate-General for Environment, 2021; Warner et al., 2017). Based on the
results of the historical flood frequency mapping (Figures 6 and 7), several
flood prevention measures were proposed for implementation in each flood
frequency class (Table 4), encompassing both structural and non-structural
approaches.
Table 4. Recommended strategies for farm flood prevention based on flood
frequency classes.
|
Flood frequency classes |
|||
|
Low-Very low flood frequency |
Moderate flood frequency |
High-Very high flood frequency |
|
|
1. Land Use Planning |
** |
*** |
**** |
|
2. Drainage Management |
* |
*** |
**** |
|
3. Conservation practices |
|
** |
**** |
|
4. Buffer Zones |
|
*** |
**** |
|
5. Erosion Control |
* |
*** |
**** |
|
6. Floodplain Management |
|
*** |
**** |
|
7. Water Storage and Detention |
|
** |
**** |
|
8. Soil Management |
** |
*** |
**** |
|
9. Communication and Education |
* |
** |
**** |
|
10. Monitoring |
** |
*** |
**** |
|
11. Flood insurance |
* |
*** |
**** |
Very high (****), high (***), moderate (**), low (*), or insignificant
(empty cell) indicate the recommended actions for flood prevention regarding
each flood frequency class
1. Land use planning: Proper land use
planning is essential to minimize the risk of flooding on farms. Avoiding
construction or farming activities in flood-prone areas can help prevent flood
damage. Identify areas at higher elevations or well-drained soils for critical
infrastructure and sensitive operations.
2. Drainage
management: Implementing effective drainage systems is crucial for both high
and low flood frequency scenarios. Maintain and regularly inspect existing
drainage ditches, channels, and culverts to ensure they are clear of debris and
functioning properly. Consider installing additional drainage infrastructure if
necessary.
3. Conservation
practices: Implement conservation practices that promote soil health and water
infiltration. Practices like contour plowing, strip cropping, cover cropping
and planting trees can help reduce surface runoff and improve soil structure,
decreasing the risk of flooding.
4. Buffer
zone and wetland restoration: Establish buffer zones or riparian buffers along
water bodies, such as rivers or streams, adjacent to the farm. These natural
vegetated areas can help absorb excess water during floods, reduce erosion, and
filter out sediment and pollutants.
5. Erosion
control: Implement erosion control measures to prevent soil erosion, which can
worsen flooding. Methods such as terracing, grassed waterways, and retaining
walls can help minimize erosion and keep soil in place.
6. Floodplain
management: If your farm is located in a floodplain, it's important to
understand the flood risks and develop appropriate floodplain management
strategies. This may include strategies like floodplain zoning, flood
forecasting, early warning systems, and emergency response planning.
7. Water
storage and detention: Constructing on-farm water storage and detention
structures, such as ponds or reservoirs, can help capture excess water during
high flood events. These structures can also be used for irrigation during dry
periods.
8. Soil
management: Maintaining healthy soils through practices like organic matter
management and appropriate crop rotation can improve soil structure and
water-holding capacity, reducing the impact of flooding.
9. Communication
and education: Promote awareness and education among farm owners, workers, and
neighboring communities about flood risks and appropriate flood prevention
measures. Encourage collaboration with local authorities, extension services,
and other stakeholders involved in water management.
10. Monitoring
networks (data and information): Effective monitoring is widely acknowledged as
a critical component of prediction and prevention strategies. In particular,
the establishment of stream/river gauges for continuous streamflow monitoring,
systematic recording and analysis of precipitation patterns and regular
monitoring of water table levels are of paramount importance. Additionally, the
installation of on-farm weather stations can provide invaluable insights to
farmers, enabling them to plan and prepare for extreme weather conditions and
optimize their planting and harvesting schedules.
11. Flood
insurance: Can help farmers prepare for and recover from such disasters.
DISCUSSION
During the
last years, the production of low-cost flood maps all around the globe has
increased, since several satellite datasets were made available for free
(Hawker et al., 2020; Mehmood et al., 2021). The analysis of long time series
of multi-temporal satellite imagery, as applied in this study, proved to be
useful information for generating flood maps. In this contribution, an
evaluation tool to translate flood data into operational maps is provided,
which allows visualizing the spatial dimension of potential floods and taking
action to prevent and reduce their damage.
The proposed method has several
strengths: firstly, cloud-cover and shadow limitations in the performance of
normalized difference indices have been overcome by including image
pre-processing procedures (e.g., C
Function of Mask algorithm, collection filtering). Secondly, the temporal
continuity of reflectance between Landsat TM, ETM+, and OLI/TIRS sensors was
undertaken by spectral harmonization following Roy et al. (2016), which allowed
the analysis of long-time series of multiple sensors properly. Thirdly, the proposed
identification of flooded areas created by the combination of spectral indices
(i.e., MNDWI and NDVI) provided more
accurate information related to the associated flooding events. In this sense,
the NDVI proved to be a powerful tool to differentiate between open water
surfaces and flooded vegetation previously detected as water by MNDWI, as the NDVI
response during flood events is highly sensitive to inundation (Powell et al.,
2014), and it is usually underestimated at flooding detection. Finally, the
selection of a training area within the study area (i.e., watershed), where differences between water, land, and
vegetation are exposed, was a key point to enhance the Otsu dynamic threshold
selection of the utilized normalized difference indices for flood mapping of
the QGRW.
Delineation of water and monitoring
of water body changes have been successfully performed by the computation of
Normalized Difference Water Indices (NDWI) worldwide (Jain & Sinha, 2005;
McFeeters, 1996; Rogers & Kearney, 2004; Sethre et al., 2005; Xu, 2006,
among others). Particularly, the MNDWI proposed by Xu (2006) is the best option
for delineating surface water in Landsat imagery, since it improves the
separation of built-up features and vegetation (Campos et al., 2012; Mohammadi
et al., 2017) from water. However, the threshold between water and non-water
features is not a constant value; instead, it is a dynamic value that changes
according to the subpixel land-cover components. Thus, for a given water
fraction, the thresholds can be determined more efficiently by examining the
histogram of the MNDWI image (Ji et al., 2009). In this sense, Otsu’s threshold
selection method for gray-level histograms is appropriate since it is simple,
nonparametric, unsupervised, and automatic (Otsu, 1979). For a better
implementation of this method, a training area with clear differences between
the targets of the study (i.e.,
water, non-water) might be selected, and obtained thresholds can then be
applied to the entire study area.
In the case of NDVI, several studies
use this index to detect water and flooding (Domenikiotis et al., 2003;
Shrestha et al., 2017). Nonetheless, it remains a vegetation index that is
strongly sensitive to the subpixel vegetation component, which makes it less
suitable for delineating water unless the SWIR band is not available in the
remote sensor (Ji et al., 2009). Concerning flood events, very low values of
NDVI are expected when the soil/vegetation component is flooded. But this
behavior is different in areas adapted to the flood pulse (Powell et al.,
2014). In the proposed study area, the subpixel components of floodplains
located at rivers and streams, in addition to wetland vegetated areas are
highly responsive to NDVI during flooding pulses. Thus, a combination of MNDWI
and NDVI can be used that assess not only the open water flooding but also the
productivity response to flooding, according to the vegetation response. This
combination of indices has been already used by several authors for monitoring
flooding areas (Azedou et al., 2022; Mehmood et al., 2021; Solana et al.,
2021b, among others). However, most of these studies focused on the detection
of open water surfaces and disregarded the FV class, which can lead to an
underestimation of the extent of inundation. The present work gives some
advances in the detection and extraction not only of open flood surfaces but
also of flooded areas underneath vegetation, allowing the creation of much more
realistic scenarios of flooding.
In the QGRW, differences between the
spatial distribution and frequency of potential floods in both OFS and FV can
be attributed to the watershed dynamics of this poorly drained landscape.
Regarding OFS, the Moderate to Very High flood frequency categories
were observed mainly in temporary water bodies. This was particularly evident
in the hills with shallow lakes located at the southwestern limit of this plain
river watershed, where Solana et al. (2021a) proposed a regional discharge area
associated with the presence of a hydraulic barrier to the Pampean aquifer
in-depth. Similar behavior was observed in the poorly drained alluvial plain,
where the Very Low to Moderate frequency categories of both
OFS and FV can be attributed to the groundwater rise. In this sense, it has
been recently observed in the South American plains that initial deep
groundwater levels do not recover because of the replacement of natural
pastures and native vegetation by rainfed agriculture, which leads to flooding
even under low rainfall scenarios (Houspanossian et al. 2023). Conversely, the Very Low flood frequency category of OFS
also occurred in the main rivers, which may be related to important but
isolated overflows. In the case of FV areas, the Very Low to Moderate
categories were observed primarily in floodplains along rivers and streams,
which can be related to the typical discharge behavior of these watercourses
that flood along surrounding croplands.
Flood mapping in other basins with
similar geographical, climatological, and geomorphological features could apply
the method followed in this study by adapting the algorithm and adjusting the
thresholds for detecting floods in comparable areas, for future implementation
of flood prevention strategies. By engaging in good planning and making
strategic investments, private landowners and agricultural producers can
proactively prevent flooding and safeguard their land interests and assets.
While farmers cannot entirely prevent flooding, they can significantly reduce
the potential damage and negative impacts on their agricultural operations by
implementing these strategies and taking appropriate actions. It is crucial for
farmers to assess their specific circumstances, local conditions, and flood
risk profiles to determine the most appropriate combination of flood prevention
measures for their farms. Additionally, staying updated with local regulations,
guidelines, and best practices related to flood management is essential.
CONCLUSIONS
This study contributed to the
generation of flood inundation extent and frequency maps along rivers in plain
watershed basins, which is of particular importance for flood monitoring and
assessment of these environments. By using the advantages offered by the GEE
platform, the historical analysis of multi-temporal Landsat images was achieved
without downloading and performing time and memory-system-intensive tasks.
The proposed rainfall and
multi-temporal flood analysis suggested a strong connection between flooded
areas and the ruling climatic conditions of the QGRW, with increases in
precipitation during the summer, and increases in flooded areas attributed to
the decrease in evapotranspiration that arises during the winter. In the case
of frequency analysis, the dominance of Very
Low frequencies of flooding (AWPF < 20%) observed in both OFS and FV
areas, highlighted the importance of flash flood events in the knowledge of
areas potentially prone to flooding expected in plain watersheds.
The differentiation of OFS and FV
from non-flooded areas was achieved by the combination of MNDWI and NDVI, with
the NDVI as a powerful tool to evaluate the vegetation response to flooding.
Here, the application of the Otsu method to compute the dynamic segmentation of
the normalized difference histograms was a key step to define the dynamic
threshold values according to the fractional components of water, soil, and
vegetation, instead of using constant values.
Overall, this study provided
valuable information for flood management and mitigation efforts in Argentina's
agriculturally dominated river watersheds. Implementing these mapping
techniques on a broader scale can contribute to more effective preparedness,
response, and recovery strategies for flood-prone regions in Argentina and
beyond.
DATA AVAILABILITY
The codes developed in the current
study are available in the Google Earth Engine platform: https://code.earthengine.google.com/b5645a358ff74f7c0286624f4451e6d3 for multi-temporal flood analysis, and
for annual flood frequency mapping: https://code.earthengine.google.com/79eff9484ce89ef2bc402677d18284c1.
ACKNOWLEDGMENTS
This work was financially supported
by the National Agency for Scientific and Technological Promotion (PICT
1616/14), the National University of Mar del Plata (R354220), and the
International Atomic Energy Agency’s Coordinated Research Project (F30059) entitled
“Assessment of Groundwater Resources at Local/National Scales”. The
authors give posthumous thanks to Ms. Joanie López Pueyrredón, who performed a
very important role in monitoring and logistical support.
REFERENCES
Antolini, F., Tate, E., Dalzell, B., Young, N.,
Johnson, K. & Hawthorne, P. L. (2020). Flood risk reduction from
agricultural best management practices. JAWRA Journal of the American Water
Resources Association, 56(1), 161-179.
https://doi.org/10.1111/1752-1688.12812
Aragón, R., Jobbágy, E. & Viglizzo, E.
(2011). Surface and groundwater dynamics in the sedimentary plains of the
Western Pampas (Argentina). Ecohydrology 4, 433–447.
https://doi.org/10.1002/eco.149
Azedou, A., Khattabi, A. & Lahssini, S.
(2022). Characterizing fluvial geomorphological change using Google Earth
Engine (GEE) to support sustainable flood management in the rural municipality
of El Faid. Arabian Journal of Geosciences, 15, 413.
https://doi.org/10.1007/s12517-022-09674-3
Alderman, K., Turner, L. & Tong, S. (2012).
Floods and human health: A systematic review. Environment International, 47,
37–47. https://doi.org/10.1016/j.envint.2012.06.003
Borro, M., Morandeira, N., Salvia, M., Minotti,
P., Perna, P. & Kandus, P. (2014). Mapping shallow lakes in a large South American
floodplain: A frequency approach on multitemporal Landsat TM/ETM data. Journal
of Hydrolgy, 512, 39–52. https://doi.org/10.1016/j.jhydrol.2014.02.057
Campo de Ferreras, A. M.
& Piccolo, M. C. (1999). Hidrogeomorfología de la cuenca del Río Quequén Grande, Argentina. Papeles
de Geografía, 29. https://revistas.um.es/geografia/article/view/45221
Campos, J., Sillero, N.
& Brito, J. (2012). Normalized difference water indexes have dissimilar
performances in detecting seasonal and permanent water in the Sahara – Sahel
transition zone. Journal of Hydrolgy 464-465, 438–446.
https://doi.org/10.1016/j.jhydrol.2012.07.042
Dash, P. & Sar, J.
(2020). Identification and validation of potential flood hazard area using
GIS-based multi-criteria analysis and satellite data-derived water index. Journal
of Flood Risk Management, 13(3), 1-14. https://doi.org/10.1111/jfr3.12620
Detrembleur, S., Stilmant,
F., Dewals, B., Erpicum, S., Archambeau, P. & Pirotton, M. (2015). Impacts
of climate change on future flood damage on the river Meuse, with a distributed
uncertainty analysis. Natural Hazards, 77, 1533-1549.
https://doi.org/10.1007/s11069-015-1661-6
DeVries, B., Huang, C., Armston, J., Huang, W.,
Jones, J. & Lang, M. (2020). Rapid and robust monitoring of flood events
using Sentinel-1 and Landsat data on the Google Earth Engine. Remote Sensing
of Environment, 240, 1-15. https://doi.org/10.1016/j.rse.2020.111664
Domenikiotis, C., Loukas,
A. & Dalezios, N. (2003). The use of NOAA/AVHRR satellite data for
monitoring and assessment of forest fires and floods. Natural Hazards and
Earth System Sciences, 3, 115–128, https://doi.org/10.5194/nhess-3-115-2003
Du, S., Shi, P., Van Rompaey, A. & Wen, J.
(2015). Quantifying the impact of impervious surface location on flood peak
discharge in urban areas. Natural Hazards, 76, 1457–1471.
https://doi.org/10.1007/s11069-014-1463-2
European Commission - Directorate-General for
Environment. (2021). Strengthening the synergies between agriculture and flood
risk management in the European Union. Publications Office of the European
Union, 31 pp, https://doi.org/10.2779/128153
Fan, Y., Li, H. & Miguez-Macho,
G. (2013). Global Patterns of Groundwater Table Depth. Science, 339,
940–943. https://doi.org/10.1126/science.1229881
Feloni, E., Mousadis, I. &Baltas, E.
(2019). Flood vulnerability assessment using a GIS-based multi-criteria
approach – The case of Attica region. Journal of Flood Risk Management, 13,
1-15. https://doi.org/10.1111/jfr3.12563
Foga, S., Scaramuzza, P., Guo, S., Zhu, Z.,
Dilley Jr, R., Beckmann, T., Schmidt, G., Dwyer, J., Hughes, M. & Laue, B.
(2017). Cloud detection algorithm comparison and validation for operational
Landsat data products. Remote Sensing of Environment, 194, 379-390.
https://doi.org/10.1016/j.rse.2017.03.026
Gorelick, N., Hancher, M.,
Dixon, M., Ilyushchenko, S., Thau, D. & Moore, R. (2017). Google Earth
Engine: Planetary-scale geospatial analysis for everyone. Remote Sensing of
Environment, 202, 18–27.
https://doi.org/https://doi.org/10.1016/j.rse.2017.06.031
Haldane, J. (1948). Note on the Median of a
Multivariate Distribution. Biometrika, 35, 414-417. https://doi.org/10.1093/biomet/35.3-4.414
Hawker, L., Neal, J., Tellman, B., Liang, J.,
Schumann, G., Doyle, C., Sullivan, J., Savage, J. & Tshimanga, R. (2020).
Comparing earth observation and inundation models to map flood hazards. Environmental
Research Letters, 15, 1-13. https://doi.org/10.1088/1748-9326/abc216
Houspanossian, J.,
Giménez, R., Whitworth-Hulse, J. I., Nosetto, M. D., Tych, W., Atkinson, P. M.,
Rufino, M. C. & Jobbágy, E. G. (2023). Agricultural expansion raises
groundwater and increases flooding in the South American plains. Science,
380(6652), 1344-1348. https://doi.org/10.1126/science.add5462
Houspanossian, J., Kuppel,
S., Nosetto, M., Di Bella, C., Oricchio, P., Barrucand, M., Rusticucci, M.
& Jobbágy, E. (2018). Long-lasting floods buffer the thermal regime of the
Pampas. Theoretical and Applied Climatology, 131, 111-120.
https://doi.org/10.1007/s00704-016-1959-7
Jain, V. & Sinha, R.
(2005). Response of active tectonics on the alluvial Baghmati River, Himalayan
foreland basin, eastern India. Geomorphology, 70, 339–356.
https://doi.org/10.1016/j.geomorph.2005.02.012
Ji, L., Zhang, L. & Wylie, B. (2009).
Analysis of Dynamic Thresholds for the Normalized Difference Water Index. Photogrammetric
Engineering & Remote Sensing, 75(11), 1307–1317.
https://doi.org/10.14358/PERS.75.11.1307
Kumar, H., Karwariya, S. & Kumar, R.
(2022). Google Earth Engine-Based Identification of Flood Extent and
Flood-Affected Paddy Rice Fields Using Sentinel-2 MSI and Sentinel-1 SAR Data
in Bihar State, India. Journal of the Indian Society of Remote Sensing, 50,
791-803. https://doi.org/10.1007/s12524-021-01487-3
Kuppel, S., Houspanossian,
J., Nosetto, M. & Jobbágy, E. (2015). What does it take to flood the
Pampas?: Lessons from a decade of strong hydrological fluctuations. Water
Resources Research, 51, 2937–2950. https://doi.org/10.1002/2015WR016966
Lal, P., Prakash, A. & Kumar, A. (2020).
Google Earth Engine for concurrent flood monitoring in the lower basin of
Indo-Gangetic-Brahmaputra plains. Natural Hazards, 104, 1947-1952.
https://doi.org/10.1007/s11069-020-04233-z
Marini, M. F. &
Piccolo, M. C. (2005). Hidrogeomorfología
de la cuenca del río Quequén Salado, Argentina. Investigaciones Geográficas,
37, 59-71. https://doi.org/10.14198/INGEO2005.37.04
Martínez, D. E., Solomon, K., Quiroz Londoño, O., Dapeña, C., Massone, H., Benavente, M., Panarello, H. & Grondona, S. (2010). Tiempo medio de residencia del flujo base en aguas superficiales de la llanura pampeana: aplicación de isótopos del agua, gases nobles y CFCs en el río Quequén Grande. In: I Congreso Internacional de Hidrología de Llanuras Azul, Buenos Aires, Argentina, 420-427.
Martínez, D. E. & Bocanegra, E. M. (2002). Hydrogeochemistry and
cation-exchange processes in the coastal aquifer of Mar Del Plata, Argentina. Hydrogeology
Journal, 10, 393–408. https://doi.org/10.1007/s10040-002-0195-7
McFeeters, S. (1996). The
Use of Normalized Difference Water Index (NDWI) in the Delineation of Open
Water Features. International Journal of Remote Sensing, 17(7),
1425–1432. https://doi.org/10.1080/01431169608948714
Mehmood, H., Conway, C.
& Perera, D. (2021). Mapping of Flood Areas Using Landsat with Google Earth
Engine Cloud Platform. Atmosphere, 12(7), 1-16.
https://doi.org/10.3390/atmos12070866
Mohammadi, A., Costelloe, J. & Ryu, D.
(2017). Application of time series of remotely sensed normalized difference
water, vegetation and moisture indices in characterizing flood dynamics of
large-scale arid zone floodplains. Remote Sensing of Environment, 190,
70–82. https://doi.org/10.1016/j.rse.2016.12.003
Mora, D., Walker, E. &
Venturini, V. (2021). Flood monitoring in Santa Fe using the Google Earth
Engine platform. In: XIX Workshop
on Information Processing and Control (RPIC), 1-6.
https://doi.org/10.1109/RPIC53795.2021.9648518
Otsu, N. (1979). A Threshold Selection Method
from Gray-Level Histograms. IEEE Transactions on Systems, Man, and
Cybernetics, 9, 62–66.
Pandey, A., Kaushik, K. & Parida, B. (2022). Google Earth Engine for Large-Scale Flood Mapping Using SAR Data and Impact Assessment on Agriculture and Population of Ganga-Brahmaputra Basin. Sustainability, 14(7), 4210, 1-22. https://doi.org/10.3390/su14074210
Paruelo, J., Guerschman, J. & Verón, S. R. (2005). Expansión
agrícola y cambios en el uso del suelo. Ciencia Hoy. 15(87), 14–23.
Policelli, F., Slayback, D., Brakenridge, B.,
Nigro, J., Hubbard, A., Zaitchik, B., Carroll, M. & Jung, H. (2017). The
NASA Global Flood Mapping System. Remote Sensing of Hydrological Extremes,
47–63. https://doi.org/10.1007/978-3-319-43744-6_3
Powell, S., Jakeman, A. J. & Croke, B.
(2014). Can NDVI response indicate the effective flood extent in macrophyte
dominated floodplain wetlands? Ecological Indicators, 45, 486–493.
https://doi.org/10.1016/j.ecolind.2014.05.009
Quiroz Londoño, O.,
Grondona, S., Massone, H., Farenga, M., Martínez, G. & Martínez, D. (2013).
Modelo de anegamiento y
estrategia de predicción–prevención del riesgo de inundación en áreas de
llanura: el sudeste de la provincia de Buenos Aires como caso de estudio. GeoFocus.
International Review of Geographical Information Science and Technology, 13_1, 76–98.
https://www.geofocus.org/index.php/geofocus/article/view/262
Robinson, N., Allred, B., Jones, M., Moreno,
A., Kimball, J., Naugle, D., Erickson, T. & Richardson, A. (2017). A
Dynamic Landsat Derived Normalized Difference Vegetation Index (NDVI) Product
for the Conterminous United States. Remote Sensing, 9(8), 863,1-14.
https://doi.org/10.3390/rs9080863
Rogers, A. S. &
Kearney, M., (2004). Reducing signature variability in unmixing coastal marsh
Thematic Mapper scenes using spectral indices. International Journal of
Remote Sensing, 25(12), 2317–2335. https://doi.org/10.1080/01431160310001618103
Roy, D., Kovalskyy, V.,
Zhang, H., Vermote, E., Yan, L., Kumar, S. & Egorov, A. (2016).
Characterization of Landsat-7 to Landsat-8 reflective wavelength and normalized
difference vegetation index continuity. Remote Sensing of Environment, 185,
57-70. https://doi.org/10.1016/j.rse.2015.12.024
Rozenberg, J., Dborkin, D.
V., Giuliano, F. M., Jooste, C., Mikou, M., Rodriguez Chamussy, L., Schwerhoff,
G., Turner, S. D., Vezza, E. & Walsh, B. J. (2021). Argentina - Poverty and Macro Economic Impacts of Climate Shocks
(English). Washington, D.C.: World Bank Group.
http://documents.worldbank.org/curated/en/590371624981025569/Argentina-Poverty-and-Macro-Economic-Impacts-of-Climate-Shocks
Sandoval, V. &
Sarmiento, J. (2020). A neglected issue: informal settlements, urban
development, and disaster risk reduction in Latin America and the Caribbean. Disaster
Prevention and Management, 29, 731–745.
https://doi.org/10.1108/DPM-04-2020-0115
Scarpati, O. E. & Capriolo, A. D (2013). Droughts and floods in Buenos Aires province (Argentina) and their space and temporal distribution. Investigaciones Geográficas, 82, 38–51. https://doi.org/10.14350/rig.31903
Sethre, P., Rundquist, B. & Todhunter, P.
(2005). Remote Detection
of Prairie Pothole Ponds in the Devils Lake Basin, North Dakota. GIScience&
Remote Sensing, 42(4), 277–296. https://doi.org/10.2747/1548-1603.42.4.277
Shrestha, R., Di, L., Yu, E., Kang, L., Shao,
Y. & Bai, Y. (2017). Regression model to estimate flood impact on corn
yield using MODIS NDVI and USDA cropland data layer. Journal of Integrative
Agriculture, 16(2), 398–407. https://doi.org/10.1016/S2095-3119(16)61502-2
Solana, M. X., Quiroz
Londoño, O. M., Weinzettel, P. & Donna, F. (2021a). Contributions to the
conceptual hydrogeological model of the Quequén Grande River Basin at its
southwestern limit. Boletín
Geológico y Minero, 132(1-2): 197-205. https://doi.org/10.21701/bolgeomin.132.1-2.020
Solana, M. X., Quiroz Londoño, O. M, Romanelli, A., Donna, F.,
Martínez, D. & Weinzettel, P. (2021b). Connectivity of temperate shallow lakes to
groundwater in the Pampean Plain, Argentina: A remote sensing and multi-tracer
approach. Groundwater for Sustainable Development, 13, 1-10.
https://doi.org/10.1016/j.gsd.2021.100556
Tellman, B., Sullivan, J. A.
& Doyle, C. S. (2021). Global Flood Observation with Multiple Satellites. In: Global Drought and Flood (eds H.
Wu, D.P. Lettenmaier, Q. Tang and P.J. Ward), 99–121. https://doi.org/10.1002/9781119427339.ch5
Teruggi, L., Martínez, G., Billi, P.
& Preciso, E. (2005). Geomorphologic units and sediment transport in a very
low relief basin: Rio Quequén Grande, Argentina. IAHS Publication, 299,
154–160.
Tsyganskaya, V., Martinis, S., Marzahn, P.
& Ludwig, R. (2018). SAR-based detection of flooded vegetation – a review
of characteristics and approaches. International Journal of Remote Sensing,
39(8), 2255–2293. https://doi.org/10.1080/01431161.2017.1420938
Tucker, C. J. (1979). Red and photographic
infrared linear combinations for monitoring vegetation. Remote Sensing of
Environment, 8(2), 127-150. https://doi.org/10.1016/0034-4257(79)90013-0
UN-OCHA (2020). Natural
disasters in Latin American and the Caribbean, 2000–2019. New York: United
Nations Office for the Coordination of Humanitarian Affairs.
https://www.unocha.org/publications/report/world/natural-disasters-latin-america-and-caribbean-2000-2019
United State Geological Survey. (s.f.). Landsat Known Issues. https://www.usgs.gov/core-science-systems/nli/landsat/landsat-known-issues
Vanama, V. S. K., Mandal, D. & Rao, Y. S.
(2020). GEE4FLOOD:
Rapid mapping of flood areas using temporal Sentinel-1 SAR images with Google
Earth Engine cloud platform. Journal of Applied Remote Sensing, 14(3),
1-23. https://doi.org/10.1117/1.JRS.14.034505
Wannous, C. &
Velasquez, G. (2017). United Nations Office for Disaster Risk Reduction
(UNISDR)—UNISDR’s Contribution to Science and Technology for Disaster Risk
Reduction and the Role of the International Consortium on Landslides (ICL). In: Sassa, K., Mikoš, M., Yin, Y. (eds) Advancing
Culture of Living with Landslides, 109-115.
https://doi.org/10.1007/978-3-319-59469-9_6
Warner, B. P., Schattman,
R. E. & Hatch, C.E. (2017). Farming the floodplain: Ecological and
agricultural tradeoffs and opportunities in river and stream governance in New
England’s changing climate. Case Studies in the Environment, 1(1), 1-9.
https://doi.org/10.1525/cse.2017.sc.512407
World Bank (2021). Argentina: Valuing Water -Brief for Policy
Makers. Water Security Diagnostic,
1-27.
https://documents1.worldbank.org/curated/en/945671624438916229/pdf/Argentina-Water-Security-Valuing-Water-Brief-for-Policy-Makers.pdf
Wulder, M. A. & Coops, N. C. (2014).
Satellites: Make Earth observations open access. Nature, 513, 30–31.
https://doi.org/10.1038/513030a
Xu, H. (2006).
Modification of Normalized Difference Water Index (NDWI) to Enhance Open Water
Features in Remotely Sensed Imagery. International Journal of Remote Sensing, 27(14), 3025–3033. https://doi.org/10.1080/01431160600589179
Type of
publication: ARTICLE
Received on
08/15/2023, approved for publication on 11/20/2023 and published on 12/12/2023.
CITATION
Solana,
M. X., Romanelli, A. and Quiroz Londoño, O. M. (2023). Multi-temporal flood mapping
and farm flood prevention strategies in an agriculturally dominated watershed
of Argentina. Cuadernos del CURIHAM, 29. e191.
https://doi.org/10.35305/curiham.v29i.e191
AUTORSHIP ROLES
Author contribution statement
María Ximena Solana: Conceptualization, Methodology, Developing codes in
the GEE, Writing Original Draft. Asunción Romanelli: Investigation,
Conceptualization, Writing, Reviewing and Editing. Orlando Mauricio Quiroz
Londoño: Original Idea, Project Administration, Funding Acquisition,
Supervision, Reviewing and Editing.
Disclosure statement
No potential conflict of interest
was reported by the authors.
The authors approved the final version for publication and they are able to respond to all aspects of the manuscript.
LICENSE
This is an open access
article under license: CreativeCommons Attribution-NonCommercial-ShareAlike 4.0
Internacional (CC BY-NC-SA 4.0 DEED)
(https://creativecommons.org/licenses/by-nc-sa/4.0/deed.es)
![]()